 3:25
3:25 Price Action
The Cup and Handle: Patience Pays on This Breakout (Swing Trading)
The cup and handle: a rounded base, a low-volume handle, then the breakout. Anatomy, the entry/stop/target, the buy-the-cup trap, and a real chart.
A stacking signal
Confirm that strength is on your side — momentum tells you whether buyers or sellers are actually in control at the level.
Momentum is the signal that confirms participation. Using relative strength, volume behaviour, and momentum oscillators, you check whether the move into and away from your level has conviction. Momentum keeps you from buying a level that is quietly failing and from shorting one that is being aggressively defended. It is confirmation, never a standalone trigger.
How this fits the Confluence Method ▸ 3:25 The cup and handle: a rounded base, a low-volume handle, then the breakout. Anatomy, the entry/stop/target, the buy-the-cup trap, and a real chart.
 4:56
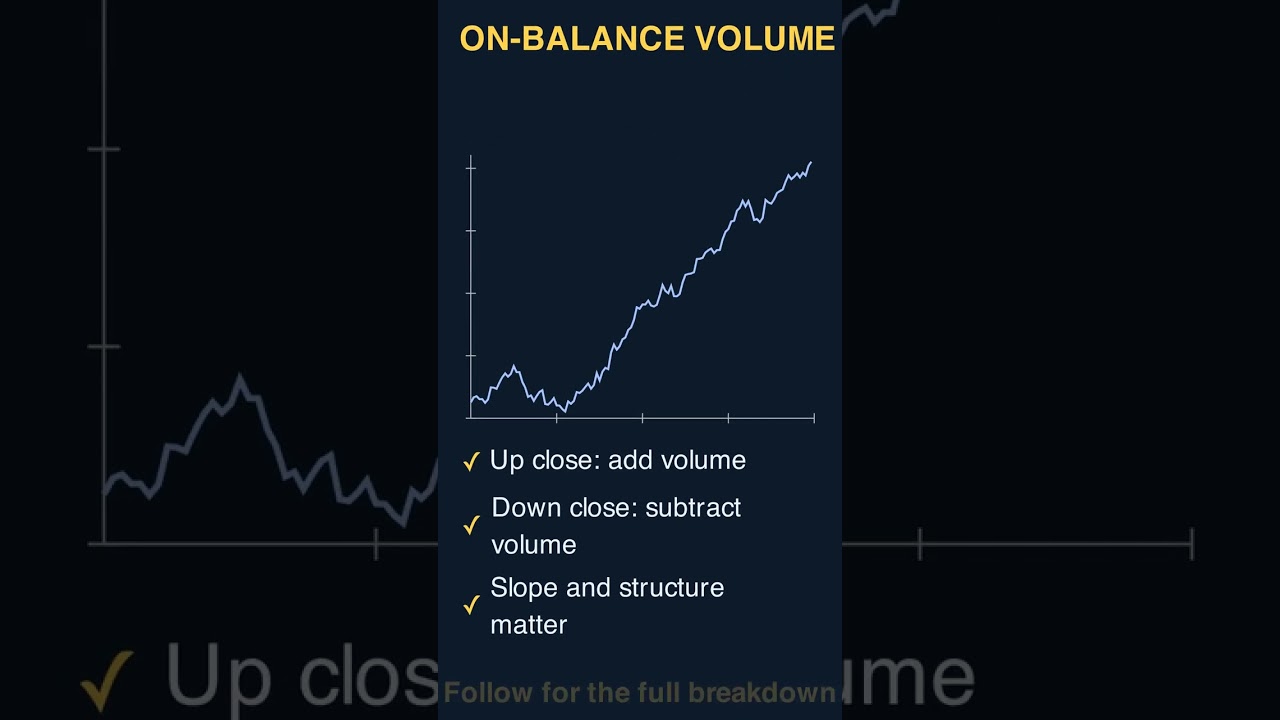
4:56 On-Balance Volume: Reading Accumulation Before Price Moves OBV is one of the most-used — and most-misused — tools in technical analysis. In this episode we break it down for serious traders: the intuition and the math, how to read it, real entry and exit signals, an analogy that makes it click, a worked example, and the pitfalls to avoid.
 4:48
4:48 Indicator-Confirmed Chart Patterns: Filtering the Noise OBV is one of the most-used — and most-misused — tools in technical analysis. In this episode we break it down for serious traders: the intuition and the math, how to read it, real entry and exit signals, an analogy that makes it click, a worked example, and the pitfalls to avoid.
 6:48
6:48 May 2026 watchlist via the Confluence Method screener: 5 S&P 500 stocks that passed all four signals — price action above a rising 50-day, breakout above the 60-day high, RSI 50-70 and rising, and a volume-confirmed trigger candle — plus 5 high-flying names every other channel will list that the method rejects (all for the same reason: RSI extended). Educational only, not financial advice.
 6:04
6:04 CCI: Spotting Cyclical Extremes CCI is one of the most-used — and most-misused — tools in technical analysis. In this episode we break it down for serious traders: the intuition and the math, how to read it, real entry and exit signals, an analogy that makes it click, a worked example, and the pitfalls to avoid.
 6:14
6:14 Stochastic RSI: Momentum of Momentum Stochastic RSI is one of the most-used — and most-misused — tools in technical analysis. In this episode we break it down for serious traders: the intuition and the math, how to read it, real entry and exit signals, an analogy that makes it click, a worked example, and the pitfalls to avoid.
 5:28
5:28 The Stochastic Oscillator, Decoded Stochastic is one of the most-used — and most-misused — tools in technical analysis. In this episode we break it down for serious traders: the intuition and the math, how to read it, real entry and exit signals, an analogy that makes it click, a worked example, and the pitfalls to avoid.
 5:12
5:12 RSI: The Overbought Trap and Divergence RSI is one of the most-used — and most-misused — tools in technical analysis. In this episode we break it down for serious traders: the intuition and the math, how to read it, real entry and exit signals, an analogy that makes it click, a worked example, and the pitfalls to avoid.
 6:07
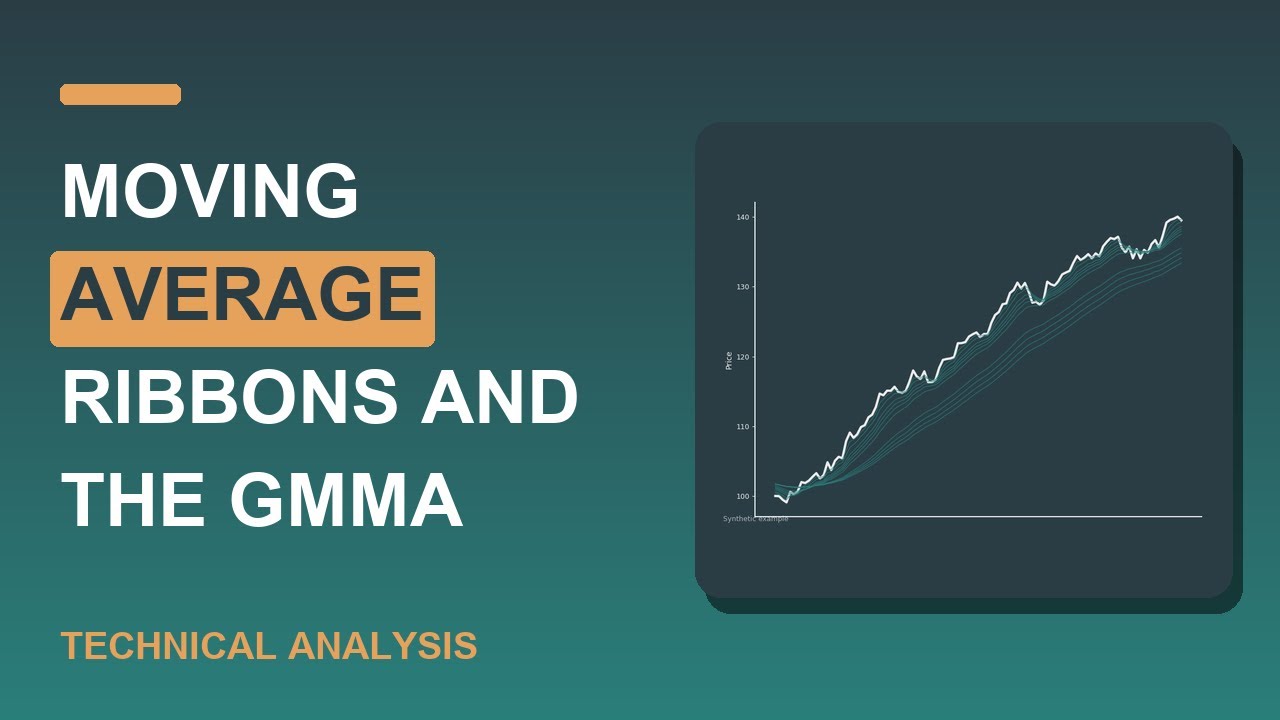
6:07 Moving Average Ribbons and the GMMA Moving Average Ribbon is one of the most-used — and most-misused — tools in technical analysis. In this episode we break it down for serious traders: the intuition and the math, how to read it, real entry and exit signals, an analogy that makes it click, a worked example, and the pitfalls to avoid.
 6:04
6:04 Multi-Timeframe Analysis: Trading in Three Dimensions Moving Averages is one of the most-used — and most-misused — tools in technical analysis. In this episode we break it down for serious traders: the intuition and the math, how to read it, real entry and exit signals, an analogy that makes it click, a worked example, and the pitfalls to avoid.
 5:51
5:51 Supertrend: A Cleaner Trend Filter Supertrend is one of the most-used — and most-misused — tools in technical analysis. In this episode we break it down for serious traders: the intuition and the math, how to read it, real entry and exit signals, an analogy that makes it click, a worked example, and the pitfalls to avoid.
 5:51
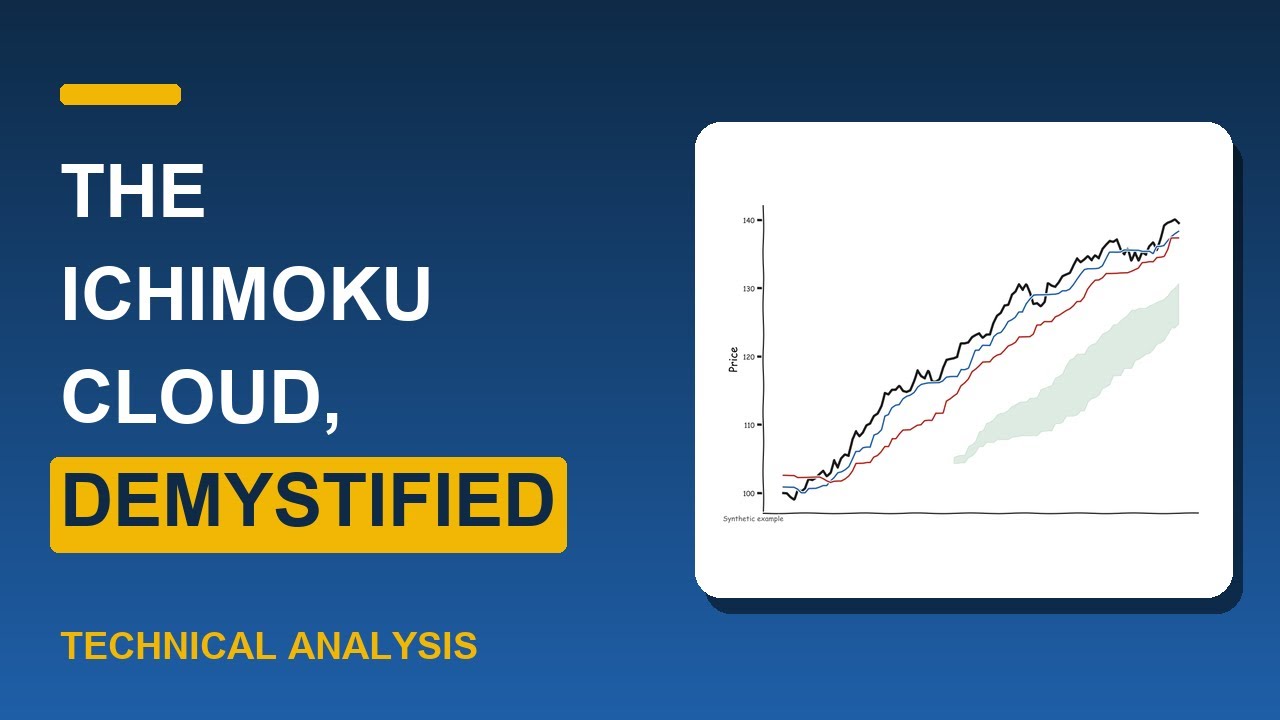
5:51 The Ichimoku Cloud, Demystified Ichimoku Cloud is one of the most-used — and most-misused — tools in technical analysis. In this episode we break it down for serious traders: the intuition and the math, how to read it, real entry and exit signals, an analogy that makes it click, a worked example, and the pitfalls to avoid.
 5:50
5:50 Parabolic SAR for Trailing Stops: The Advanced Trader's Playbook Parabolic SAR is one of the most-used — and most-misused — tools in technical analysis. In this episode we break it down for serious traders: the intuition and the math, how to read it, real entry and exit signals, an analogy that makes it click, a worked example, and the pitfalls to avoid.
 4:48
4:48 ADX and DMI: Measuring Trend Strength ADX is one of the most-used — and most-misused — tools in technical analysis. In this episode we break it down for serious traders: the intuition and the math, how to read it, real entry and exit signals, an analogy that makes it click, a worked example, and the pitfalls to avoid.
 5:28
5:28 Fibonacci Retracements and Extensions: An Advanced Trader's Guide Fibonacci is one of the most-used — and most-misused — tools in technical analysis. In this episode we break it down for serious traders: the intuition and the math, how to read it, real entry and exit signals, an analogy that makes it click, a worked example, and the pitfalls to avoid.
 5:48
5:48 The Accumulation/Distribution Line: Reading the Footprints of Smart Money Accumulation/Distribution is one of the most-used — and most-misused — tools in technical analysis. In this episode we break it down for serious traders: the intuition and the math, how to read it, real entry and exit signals, an analogy that makes it click, a worked example, and the pitfalls to avoid.
 6:28
6:28 The Bollinger Band Squeeze: Trading Volatility Compression Bollinger Bands is one of the most-used — and most-misused — tools in technical analysis. In this episode we break it down for serious traders: the intuition and the math, how to read it, real entry and exit signals, an analogy that makes it click, a worked example, and the pitfalls to avoid.
 5:05
5:05 Keltner Channels vs Bollinger Bands: The Volatility Duel Bollinger Bands is one of the most-used — and most-misused — tools in technical analysis. In this episode we break it down for serious traders: the intuition and the math, how to read it, real entry and exit signals, an analogy that makes it click, a worked example, and the pitfalls to avoid.
 5:28
5:28 Money Flow Index: The Volume-Weighted RSI Money Flow Index is one of the most-used — and most-misused — tools in technical analysis. In this episode we break it down for serious traders: the intuition and the math, how to read it, real entry and exit signals, an analogy that makes it click, a worked example, and the pitfalls to avoid.
 5:51
5:51 Rate of Change: Reading Pure Price Momentum Rate of Change is one of the most-used — and most-misused — tools in technical analysis. In this episode we break it down for serious traders: the intuition and the math, how to read it, real entry and exit signals, an analogy that makes it click, a worked example, and the pitfalls to avoid.
 5:33
5:33 ATR and Volatility-Based Stops: The Advanced Trader's Guide ATR is one of the most-used — and most-misused — tools in technical analysis. In this episode we break it down for serious traders: the intuition and the math, how to read it, real entry and exit signals, an analogy that makes it click, a worked example, and the pitfalls to avoid.
 4:53
4:53 Bollinger Bands: Mean Reversion and Trend Bollinger Bands is one of the most-used — and most-misused — tools in technical analysis. In this episode we break it down for serious traders: the intuition and the math, how to read it, real entry and exit signals, an analogy that makes it click, a worked example, and the pitfalls to avoid.
 5:52
5:52 Williams %R Explained: An Advanced Trader's Guide Williams %R is one of the most-used — and most-misused — tools in technical analysis. In this episode we break it down for serious traders: the intuition and the math, how to read it, real entry and exit signals, an analogy that makes it click, a worked example, and the pitfalls to avoid.
 5:54
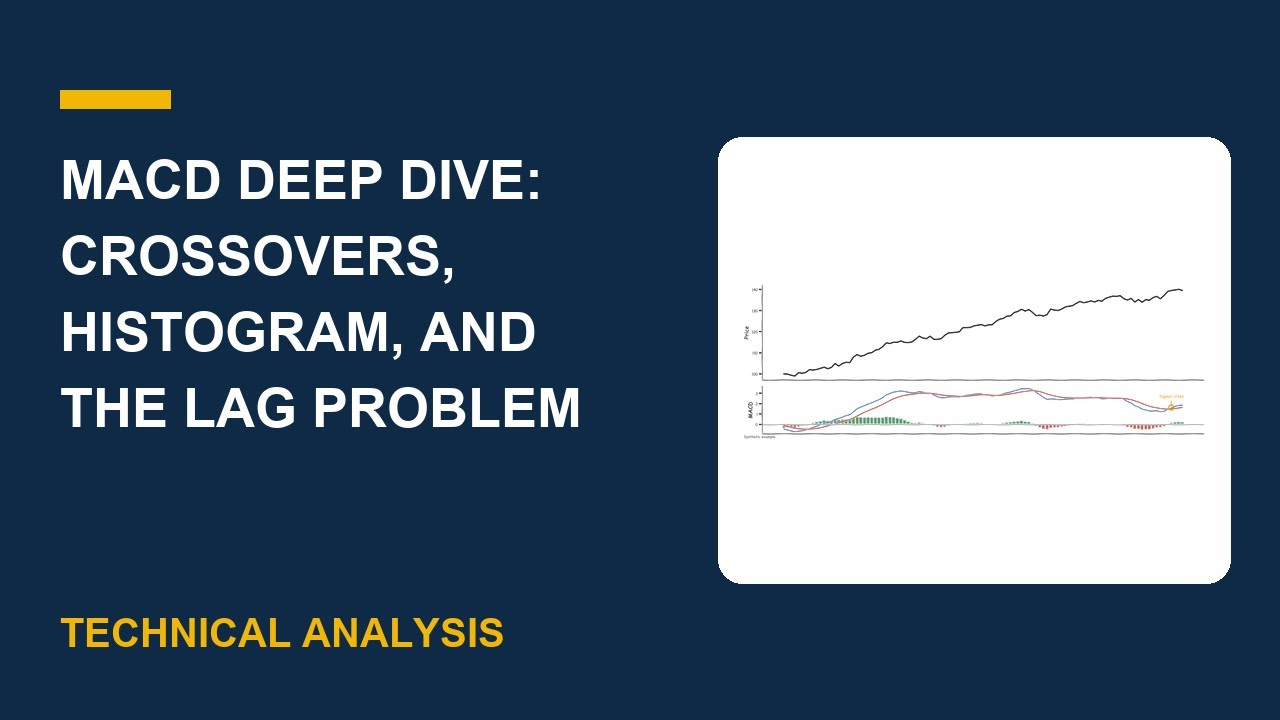
5:54 MACD Deep Dive: Crossovers, Histogram, and the Lag Problem MACD is one of the most-used — and most-misused — tools in technical analysis. In this episode we break it down for serious traders: the intuition and the math, how to read it, real entry and exit signals, an analogy that makes it click, a worked example, and the pitfalls to avoid.
 6:53
6:53 Moving Averages: SMA vs EMA and the Crossover Moving Averages is one of the most-used — and most-misused — tools in technical analysis. In this episode we break it down for serious traders: the intuition and the math, how to read it, real entry and exit signals, an analogy that makes it click, a worked example, and the pitfalls to avoid.
 7:13
7:13 Market Analysis | Price Action Secrets | Boost Your Trading | Cash the Future Market Analysis Secrets Mastering Stock Charts The Ultimate Guide to Market Analysis How to Read Stock Charts Like a Pro (Market Analysis Secrets) Technical Analysis 101 Decode Market Trends & Boost Your Trading Want to master technical analysis and improve your trading skills? In this video, we’ll break down the essentials of reading stock charts, understanding indicators, and spotting trends to make smarter trading decisions.
 7:59
7:59 Double RSI Trading Strategy 2025: How to Win Without Losses in Forex, Stocks & Crypto 📈 Looking for a high-accuracy trading strategy that minimizes losses and maximizes wins? The Double RSI strategy is one of the most effective ways to filter out false signals, confirm strong trends, and improve trade execution.
 4:47
4:47 5 Trading Mistakes Killing Your Profits (Learn How to Avoid Them) Trading Mistakes to Avoid in 2025 Are your trading profits slipping away despite your best efforts? You’re not alone.
 5:39
5:39 How to Get Rich With Trading in Futures (Secrets to Earning BIG in 2025) #howtodaytrade Are you ready to uncover the secrets to earning BIG in Futures Trading? In this video, I jumped deep into the strategies, tools, and mindset that separate successful traders from those who struggle.
 0:31
0:31  0:17
0:17  0:30
0:30  0:30
0:30 The Accumulation/Distribution Line Follow for the full breakdown.
 0:31
0:31 The Accumulation/Distribution Line Follow for the full breakdown.
 0:53
0:53 How to Use RSI (Relative Strength Index) #finance #stockmarket #shorts Special Discount Coupon for Prop Trading Firm https://apextraderfunding. com/member/aff/go/jdmtventuresllc?
 4:52
4:52 *PRO Traders REVEAL Their Top RSI and MACD Secrets! * Special Discount Coupon for Prop Trading Firm https://apextraderfunding.
 2:14
2:14 🌟 Top Psychologist Reveals Success Secrets of Highly Driven People 🌟 In this motivational video, we explore the journey to success, especially for those trading stocks, options, and navigating the financial markets. Success isn’t about perfection—it’s about resilience, learning from your experiences, and celebrating every small victory along the way.
Relative strength versus the broader market, volume expansion on the move you want to join, and a momentum oscillator (such as RSI or MACD) read for agreement with structure — not for crossovers in isolation.
No. Momentum is one of four signals. Without aligned structure, a key level, and a defined trigger, strong momentum is just noise you are tempted to chase.
We use privacy-friendly analytics (Google Analytics & Microsoft Clarity) to understand what's useful and improve the lessons. Nothing loads until you accept. See our privacy notice.
Type to search the full catalog.