 3:25New
Price Action
The Cup and Handle: Patience Pays on This Breakout (Swing Trading)
The cup and handle: a rounded base, a low-volume handle, then the breakout. Anatomy, the entry/stop/target, the buy-the-cup trap, and a real chart.
Jun 3, 2026
3:25NewThe cup and handle: a rounded base, a low-volume handle, then the breakout. Anatomy, the entry/stop/target, the buy-the-cup trap, and a real chart.
Jun 3, 2026
 3:14New
Head and shoulders: the three-peak top, the neckline that confirms it, the measured target, and the trap of shorting too early. With a real chart.
Jun 3, 2026
 3:31New
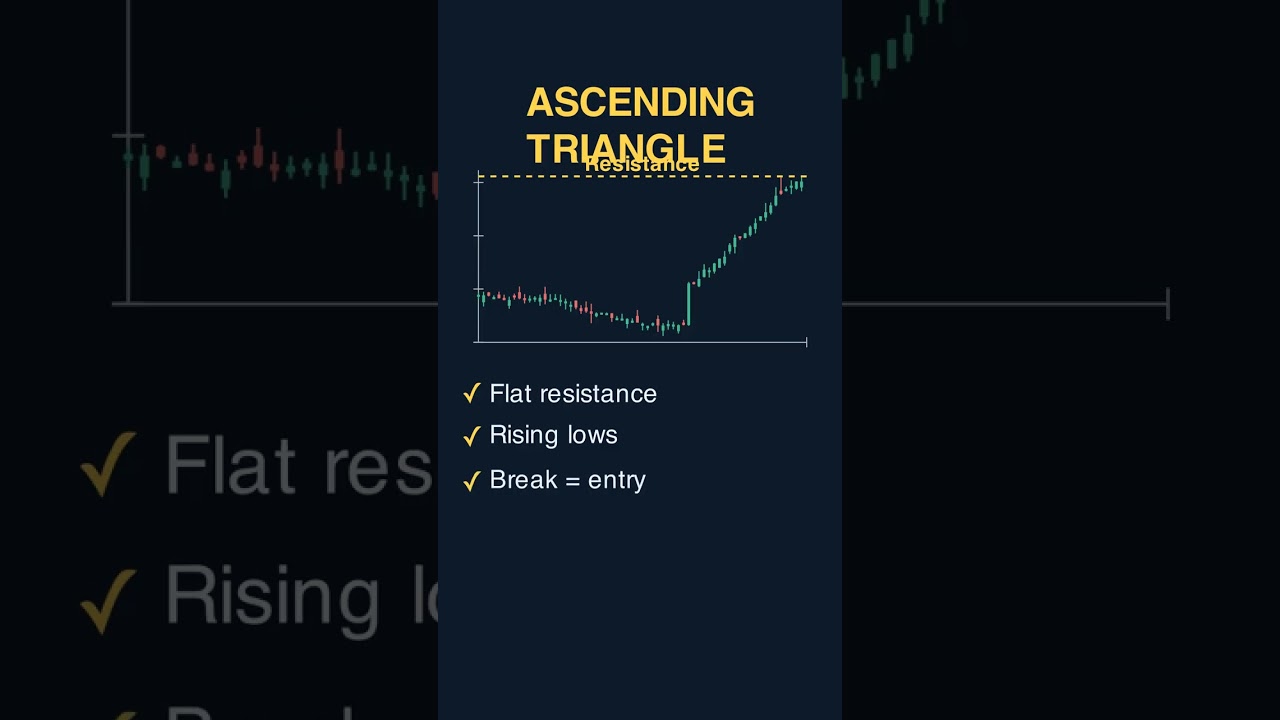
The ascending triangle: a flat resistance, rising lows, and the breakout that follows. Anatomy, the entry/stop/target, the early-entry trap, and a real chart.
Jun 2, 2026
 4:56New
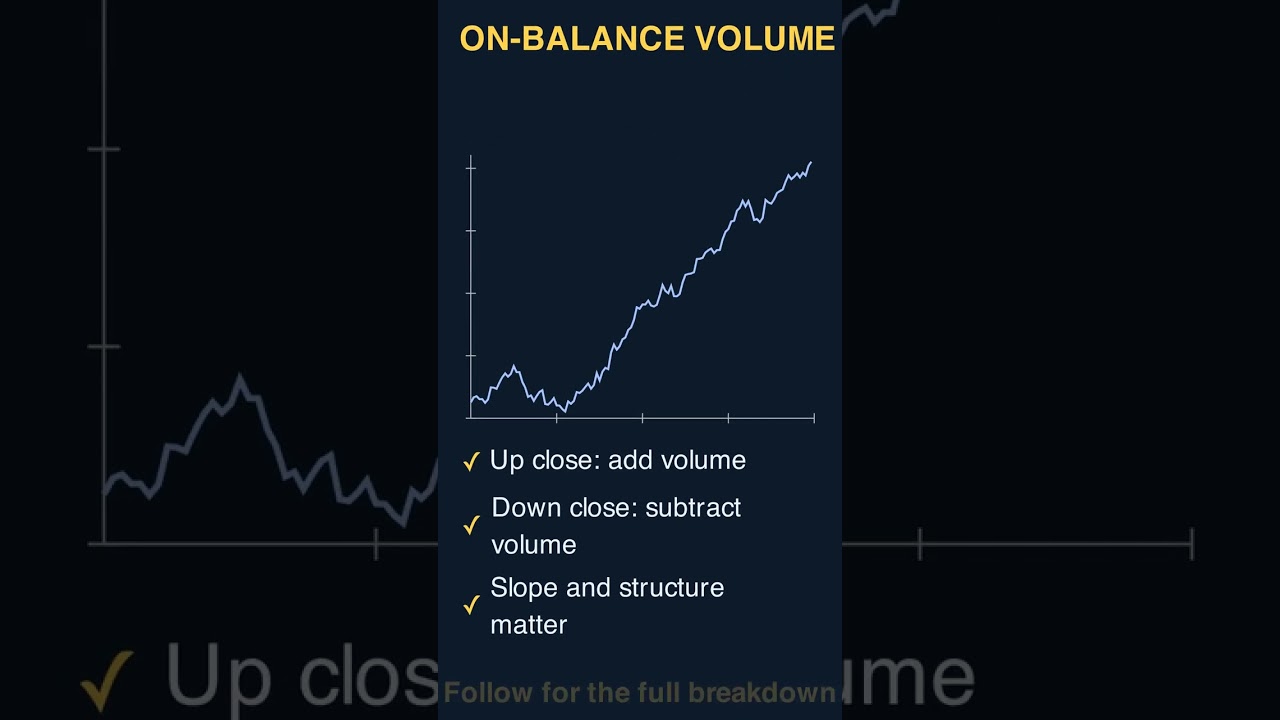
On-Balance Volume: Reading Accumulation Before Price Moves OBV is one of the most-used — and most-misused — tools in technical analysis. In this episode we break it down for serious traders: the intuition and the math, how to read it, real entry and exit signals, an analogy that makes it click, a worked example, and the pitfalls to avoid.
Jun 2, 2026
 3:42New
The pullback entry: in a healthy uptrend, buy the dip into the rising moving average instead of chasing the breakout. Anatomy, the exact entry/stop/target, the falling-knife trap, and a real chart.
Jun 2, 2026
 3:14New
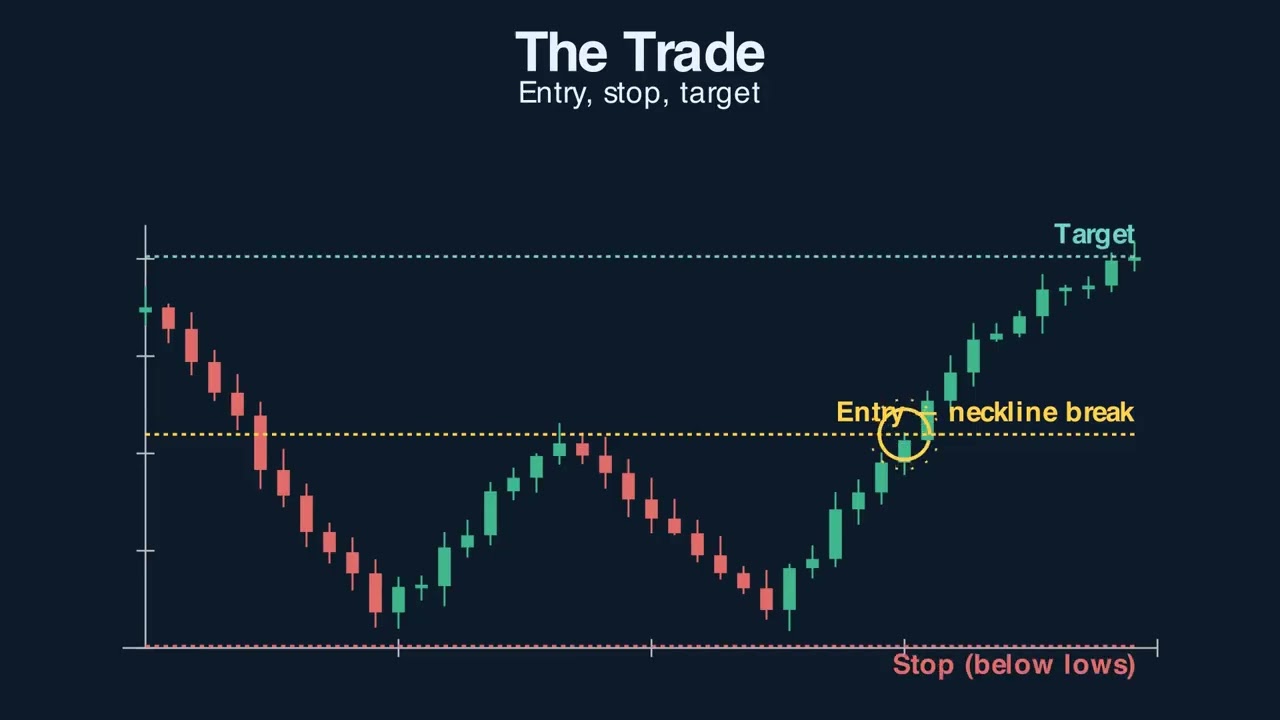
The double bottom reversal: two tests of support, the neckline that confirms it, the measured-move target, and the trap of front-running the breakout. With a real chart.
Jun 1, 2026
 3:08New
The Confluence Method: a swing trade only qualifies when four signals stack — price action/structure, a key level, momentum, and a trigger — run through one workflow: Scan, Stack, Execute, Review. Shown on animated charts and a real ticker.
May 31, 2026
 4:48New
Indicator-Confirmed Chart Patterns: Filtering the Noise OBV is one of the most-used — and most-misused — tools in technical analysis. In this episode we break it down for serious traders: the intuition and the math, how to read it, real entry and exit signals, an analogy that makes it click, a worked example, and the pitfalls to avoid.
May 31, 2026
 3:27New
Marvell up 32%, gold volume spiking, and defensive sectors leading — pre-market is already telling a story worth paying attention to this morning. Good morning and welcome to pre-market.
Jun 3, 2026
 3:44New
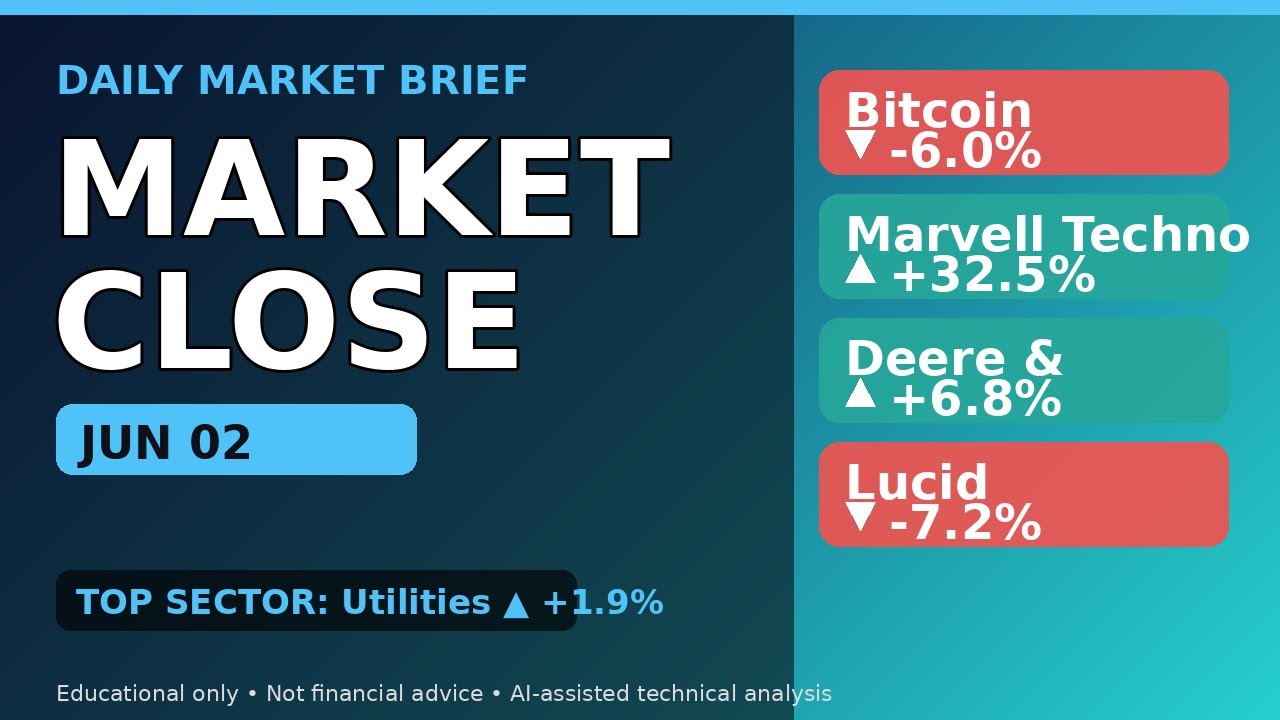
Gold saw 9. 5x its average volume Tuesday while Bitcoin cratered 6%.
Jun 2, 2026
 3:34New
Bitcoin flashing oversold while ARM and Datadog surge on earnings — this split tape has some serious rotation signals worth tracking before the open. Good morning and welcome to Tuesday June second pre-market.
Jun 2, 2026
 3:52New
Tech exploded Monday while Gold saw 10x average volume on a down move — the kind of divergence that technical signals flag as a potential shift in market structure. Monday brought a sharp divergence across the market, with Arm Holdings, Cloudflare, and Datadog posting explosive moves that dominated the session.
Jun 1, 2026
 3:39New
Tech is lighting up pre-market as Microsoft, Oracle, and Robinhood headline a risk-on open — here is what the technical signals are showing this Monday morning. Good morning and happy Monday — it is June first, and the week is kicking off with some serious pre-market fireworks from Microsoft, Oracle, and Robinhood Markets.
Jun 1, 2026
 3:54New
Risk-on signals are flashing across tech and gold — Microsoft, Oracle, and Robinhood are all making technically notable moves heading into Sunday's pre-market. Heading into Sunday's pre-market session, Microsoft, Oracle, and Robinhood Markets are all flashing technically notable moves that have this tape looking distinctly risk-on.
May 31, 2026
 4:41New
Tech surged, small caps outran blue chips, and crypto slipped — here is what the price action and technical signals are saying about where risk appetite landed this week. It was a strong week for equities ending May 29th, with technology stocks leading a broad market rally that left almost no index untouched.
May 30, 2026
 3:52New
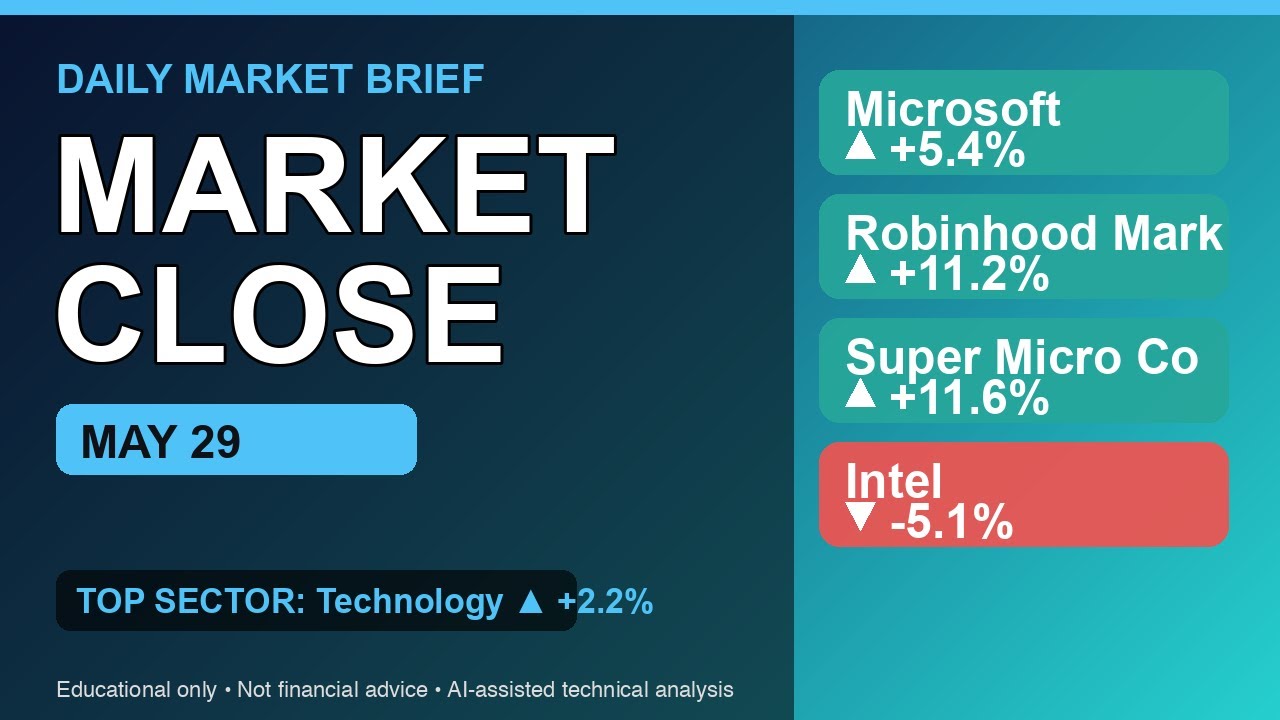
Tech ripped Friday while defensives got dumped — Microsoft, Robinhood, and Palantir led the charge as gold quietly flashed a macro signal worth watching. Friday, May 29 closed with a bang — Microsoft surged over five percent, Robinhood Markets ripped more than eleven, and Super Micro Computer joined the party with a double-digit gain of its own.
May 29, 2026
 6:48New
May 2026 watchlist via the Confluence Method screener: 5 S&P 500 stocks that passed all four signals — price action above a rising 50-day, breakout above the 60-day high, RSI 50-70 and rising, and a volume-confirmed trigger candle — plus 5 high-flying names every other channel will list that the method rejects (all for the same reason: RSI extended). Educational only, not financial advice.
May 30, 2026
3:31NewThe ascending triangle: a flat resistance, rising lows, and the breakout that follows. Anatomy, the entry/stop/target, the early-entry trap, and a real chart.
Jun 2, 2026
 6:07
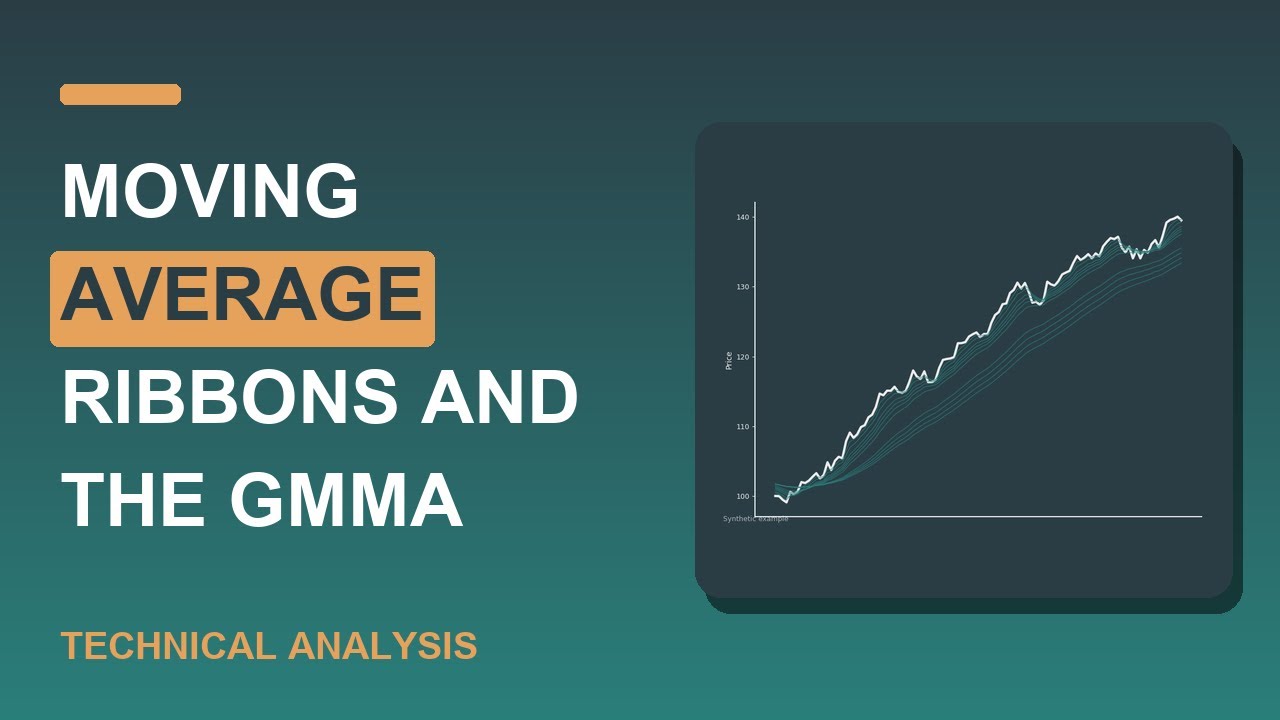
6:07Moving Average Ribbons and the GMMA Moving Average Ribbon is one of the most-used — and most-misused — tools in technical analysis. In this episode we break it down for serious traders: the intuition and the math, how to read it, real entry and exit signals, an analogy that makes it click, a worked example, and the pitfalls to avoid.
May 24, 2026
 6:04
6:04Multi-Timeframe Analysis: Trading in Three Dimensions Moving Averages is one of the most-used — and most-misused — tools in technical analysis. In this episode we break it down for serious traders: the intuition and the math, how to read it, real entry and exit signals, an analogy that makes it click, a worked example, and the pitfalls to avoid.
May 24, 2026
 5:51
5:51Supertrend: A Cleaner Trend Filter Supertrend is one of the most-used — and most-misused — tools in technical analysis. In this episode we break it down for serious traders: the intuition and the math, how to read it, real entry and exit signals, an analogy that makes it click, a worked example, and the pitfalls to avoid.
May 23, 2026
 5:51
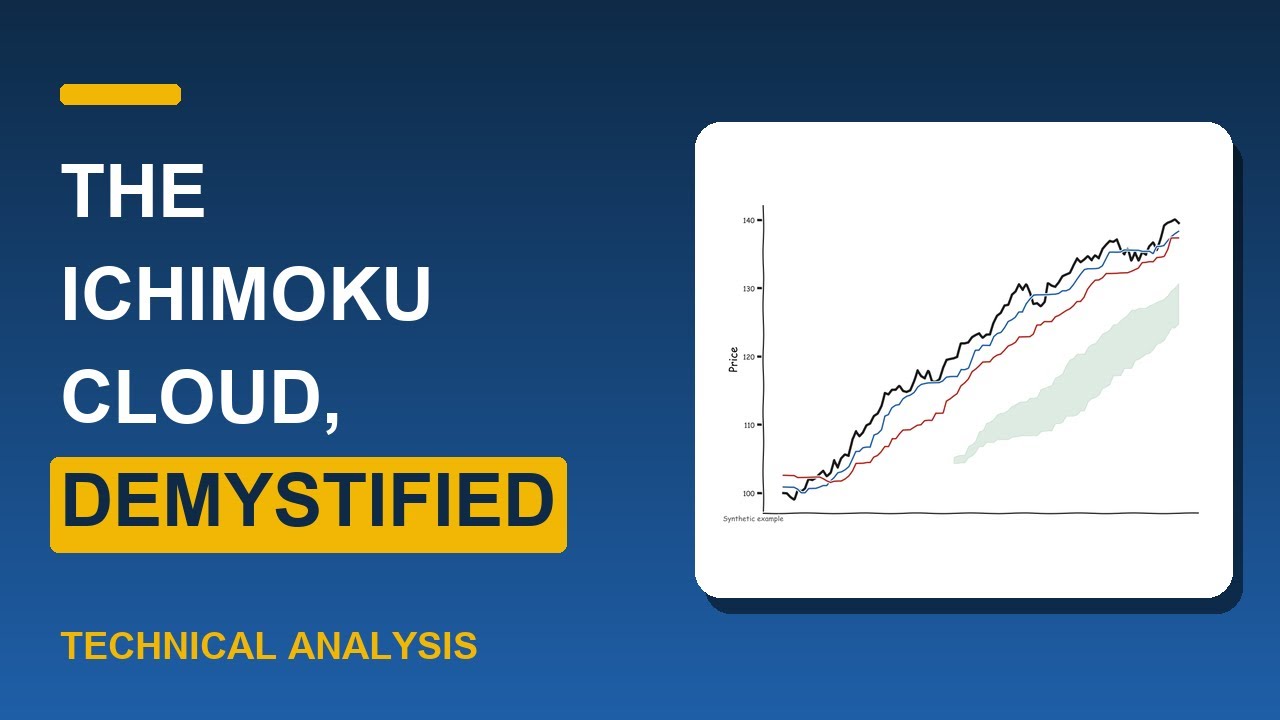
5:51The Ichimoku Cloud, Demystified Ichimoku Cloud is one of the most-used — and most-misused — tools in technical analysis. In this episode we break it down for serious traders: the intuition and the math, how to read it, real entry and exit signals, an analogy that makes it click, a worked example, and the pitfalls to avoid.
May 23, 2026
 5:50
5:50Parabolic SAR for Trailing Stops: The Advanced Trader's Playbook Parabolic SAR is one of the most-used — and most-misused — tools in technical analysis. In this episode we break it down for serious traders: the intuition and the math, how to read it, real entry and exit signals, an analogy that makes it click, a worked example, and the pitfalls to avoid.
May 23, 2026
 4:48
4:48ADX and DMI: Measuring Trend Strength ADX is one of the most-used — and most-misused — tools in technical analysis. In this episode we break it down for serious traders: the intuition and the math, how to read it, real entry and exit signals, an analogy that makes it click, a worked example, and the pitfalls to avoid.
May 22, 2026
 5:54
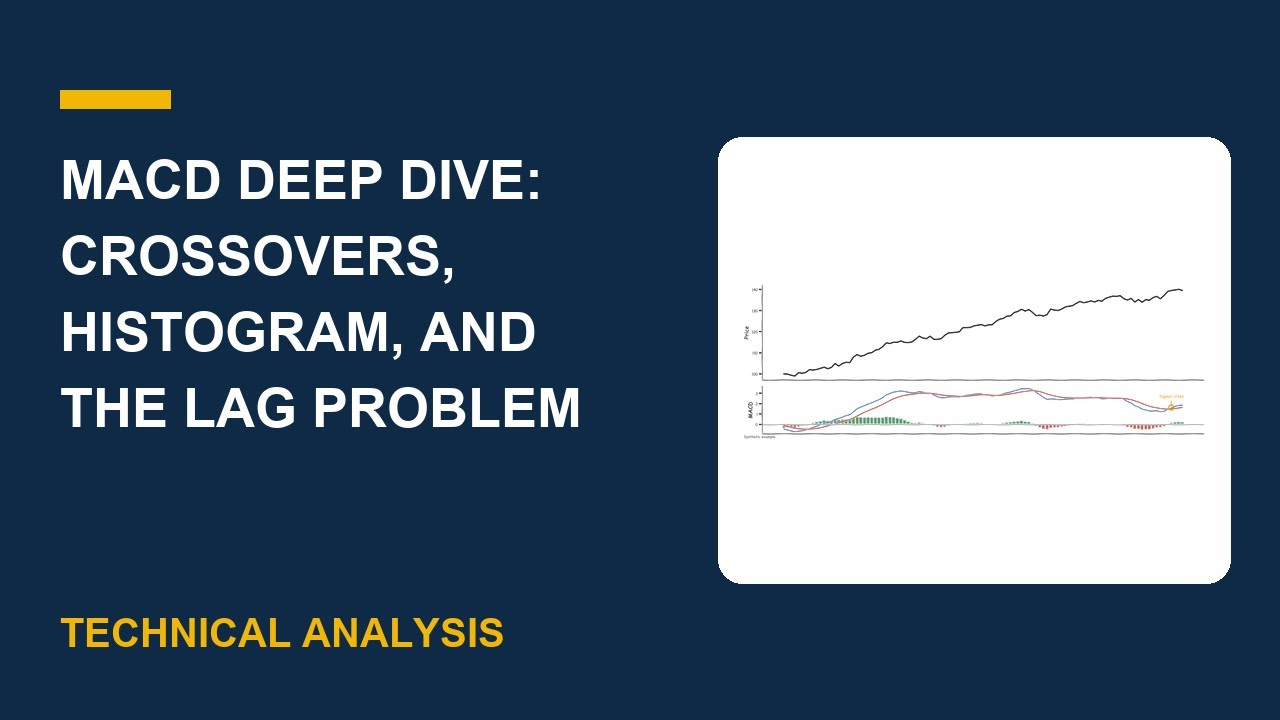
5:54MACD Deep Dive: Crossovers, Histogram, and the Lag Problem MACD is one of the most-used — and most-misused — tools in technical analysis. In this episode we break it down for serious traders: the intuition and the math, how to read it, real entry and exit signals, an analogy that makes it click, a worked example, and the pitfalls to avoid.
May 22, 2026
 6:53
6:53Moving Averages: SMA vs EMA and the Crossover Moving Averages is one of the most-used — and most-misused — tools in technical analysis. In this episode we break it down for serious traders: the intuition and the math, how to read it, real entry and exit signals, an analogy that makes it click, a worked example, and the pitfalls to avoid.
May 22, 2026
4:56NewOn-Balance Volume: Reading Accumulation Before Price Moves OBV is one of the most-used — and most-misused — tools in technical analysis. In this episode we break it down for serious traders: the intuition and the math, how to read it, real entry and exit signals, an analogy that makes it click, a worked example, and the pitfalls to avoid.
Jun 2, 2026
 6:04
6:04CCI: Spotting Cyclical Extremes CCI is one of the most-used — and most-misused — tools in technical analysis. In this episode we break it down for serious traders: the intuition and the math, how to read it, real entry and exit signals, an analogy that makes it click, a worked example, and the pitfalls to avoid.
May 25, 2026
 6:14
6:14Stochastic RSI: Momentum of Momentum Stochastic RSI is one of the most-used — and most-misused — tools in technical analysis. In this episode we break it down for serious traders: the intuition and the math, how to read it, real entry and exit signals, an analogy that makes it click, a worked example, and the pitfalls to avoid.
May 25, 2026
 5:28
5:28The Stochastic Oscillator, Decoded Stochastic is one of the most-used — and most-misused — tools in technical analysis. In this episode we break it down for serious traders: the intuition and the math, how to read it, real entry and exit signals, an analogy that makes it click, a worked example, and the pitfalls to avoid.
May 25, 2026
 5:12
5:12RSI: The Overbought Trap and Divergence RSI is one of the most-used — and most-misused — tools in technical analysis. In this episode we break it down for serious traders: the intuition and the math, how to read it, real entry and exit signals, an analogy that makes it click, a worked example, and the pitfalls to avoid.
May 24, 2026
 5:28
5:28Money Flow Index: The Volume-Weighted RSI Money Flow Index is one of the most-used — and most-misused — tools in technical analysis. In this episode we break it down for serious traders: the intuition and the math, how to read it, real entry and exit signals, an analogy that makes it click, a worked example, and the pitfalls to avoid.
May 22, 2026
 5:51
5:51Rate of Change: Reading Pure Price Momentum Rate of Change is one of the most-used — and most-misused — tools in technical analysis. In this episode we break it down for serious traders: the intuition and the math, how to read it, real entry and exit signals, an analogy that makes it click, a worked example, and the pitfalls to avoid.
May 22, 2026
 5:52
5:52Williams %R Explained: An Advanced Trader's Guide Williams %R is one of the most-used — and most-misused — tools in technical analysis. In this episode we break it down for serious traders: the intuition and the math, how to read it, real entry and exit signals, an analogy that makes it click, a worked example, and the pitfalls to avoid.
May 22, 2026
 5:48
5:48The Accumulation/Distribution Line: Reading the Footprints of Smart Money Accumulation/Distribution is one of the most-used — and most-misused — tools in technical analysis. In this episode we break it down for serious traders: the intuition and the math, how to read it, real entry and exit signals, an analogy that makes it click, a worked example, and the pitfalls to avoid.
May 22, 2026
 6:28
6:28The Bollinger Band Squeeze: Trading Volatility Compression Bollinger Bands is one of the most-used — and most-misused — tools in technical analysis. In this episode we break it down for serious traders: the intuition and the math, how to read it, real entry and exit signals, an analogy that makes it click, a worked example, and the pitfalls to avoid.
May 22, 2026
 5:23
5:23Donchian Channels and the Turtle Breakout Donchian Channels is one of the most-used — and most-misused — tools in technical analysis. In this episode we break it down for serious traders: the intuition and the math, how to read it, real entry and exit signals, an analogy that makes it click, a worked example, and the pitfalls to avoid.
May 22, 2026
 5:05
5:05Keltner Channels vs Bollinger Bands: The Volatility Duel Bollinger Bands is one of the most-used — and most-misused — tools in technical analysis. In this episode we break it down for serious traders: the intuition and the math, how to read it, real entry and exit signals, an analogy that makes it click, a worked example, and the pitfalls to avoid.
May 22, 2026
 5:33
5:33ATR and Volatility-Based Stops: The Advanced Trader's Guide ATR is one of the most-used — and most-misused — tools in technical analysis. In this episode we break it down for serious traders: the intuition and the math, how to read it, real entry and exit signals, an analogy that makes it click, a worked example, and the pitfalls to avoid.
May 22, 2026
 4:53
4:53Bollinger Bands: Mean Reversion and Trend Bollinger Bands is one of the most-used — and most-misused — tools in technical analysis. In this episode we break it down for serious traders: the intuition and the math, how to read it, real entry and exit signals, an analogy that makes it click, a worked example, and the pitfalls to avoid.
May 22, 2026
3:25NewThe cup and handle: a rounded base, a low-volume handle, then the breakout. Anatomy, the entry/stop/target, the buy-the-cup trap, and a real chart.
Jun 3, 2026
3:14NewHead and shoulders: the three-peak top, the neckline that confirms it, the measured target, and the trap of shorting too early. With a real chart.
Jun 3, 2026
3:42NewThe pullback entry: in a healthy uptrend, buy the dip into the rising moving average instead of chasing the breakout. Anatomy, the exact entry/stop/target, the falling-knife trap, and a real chart.
Jun 2, 2026
3:14NewThe double bottom reversal: two tests of support, the neckline that confirms it, the measured-move target, and the trap of front-running the breakout. With a real chart.
Jun 1, 2026
3:08NewThe Confluence Method: a swing trade only qualifies when four signals stack — price action/structure, a key level, momentum, and a trigger — run through one workflow: Scan, Stack, Execute, Review. Shown on animated charts and a real ticker.
May 31, 2026
4:48NewIndicator-Confirmed Chart Patterns: Filtering the Noise OBV is one of the most-used — and most-misused — tools in technical analysis. In this episode we break it down for serious traders: the intuition and the math, how to read it, real entry and exit signals, an analogy that makes it click, a worked example, and the pitfalls to avoid.
May 31, 2026
 1:51
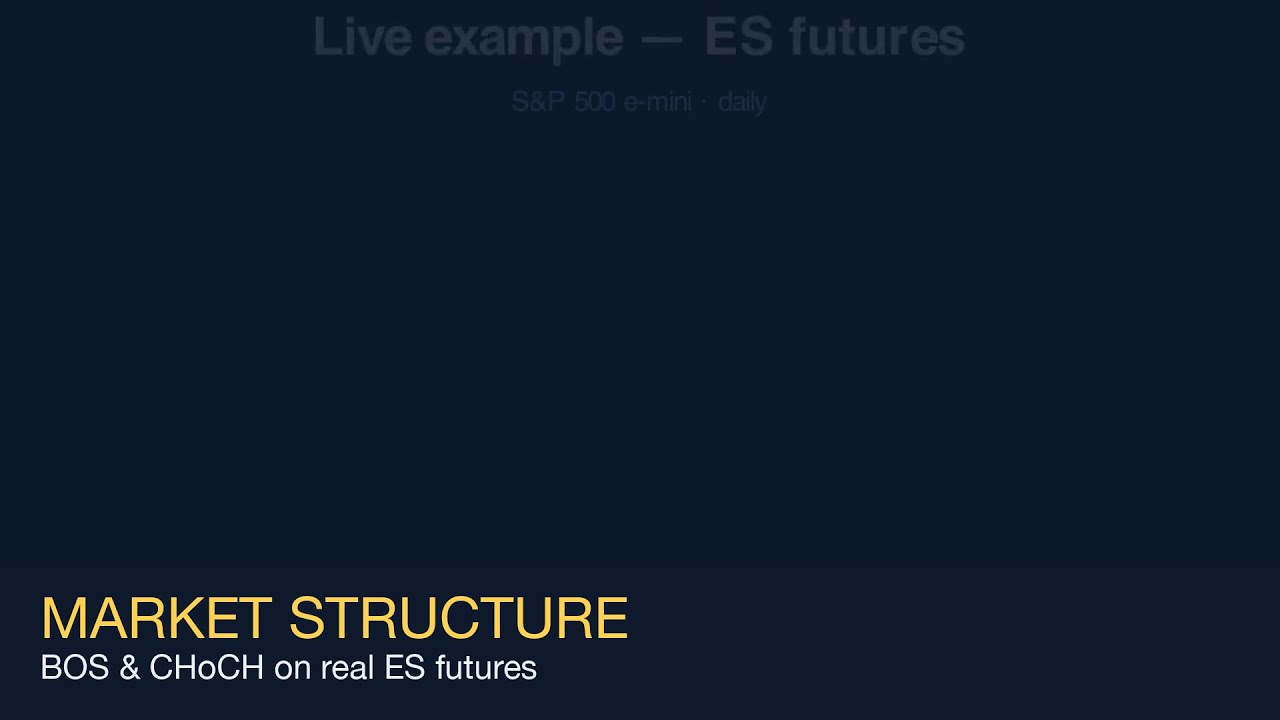
1:51Master market structure the ICT way — Break of Structure (BOS) and Change of Character (CHoCH) — the foundation every futures trader needs. We break it down on a clean idealized chart, then prove it live on real S&P 500 e-mini (ES) futures.
May 23, 2026
 5:28
5:28Fibonacci Retracements and Extensions: An Advanced Trader's Guide Fibonacci is one of the most-used — and most-misused — tools in technical analysis. In this episode we break it down for serious traders: the intuition and the math, how to read it, real entry and exit signals, an analogy that makes it click, a worked example, and the pitfalls to avoid.
May 22, 2026
 1:46
1:46Learn Stock Market Method, Trade and Grow! Welcome to Stock Market Method!
Dec 2, 2024
 5:51
5:51Prop Firm Trading (What is good or bad? ) Curious about prop firm trading?
Dec 2, 2024
 4:58
4:58Unlock the secrets to futures trading like a pro in 2025! In this video, we'll dive into the world of day trading and risk management, giving you the tools you need to achieve financial freedom.
Nov 28, 2024
 3:59
3:59Follow along a day in the life of a prop trader, making money through futures, stocks, and options trading in the market. See what it takes to succeed in the world of prop trading!
Nov 27, 2024
 5:38
5:38Learn the basics of futures contracts in this comprehensive guide! This video breaks down what futures contracts are, how they work, and why they play a critical role in trading and investing.
Nov 27, 2024
 3:18
3:18Introduction to Prop Trading: What is prop trading and how does it work? In this video, we dive into the world of proprietary trading, commonly known as prop trading.
Nov 23, 2024
 6:55
6:55Master Risk Management Like a PRO! 🚀 | Secrets to Consistent Crypto Trading Success 🔥 Master Risk Like a Pro: The Key to Trading Success!
Mar 15, 2025
 7:18
7:18Why Automate Your Trading? | Automate your Trading View Strategy | How to Automate Your Trades Why Automation Your Trading Why Every Trader Needs Automation – The Secret to Consistent Profits!
Mar 12, 2025
 4:47
4:475 Trading Mistakes Killing Your Profits (Learn How to Avoid Them) Trading Mistakes to Avoid in 2025 Are your trading profits slipping away despite your best efforts? You’re not alone.
Feb 6, 2025
 3:58
3:585 Rules to Master Trading Psychology | How I Fixed My Day Trading Mindset (Trading Secrets Revealed) Struggling with day trading losses? You're not alone!
Jan 25, 2025
 5:39
5:39How to Get Rich With Trading in Futures (Secrets to Earning BIG in 2025) #howtodaytrade Are you ready to uncover the secrets to earning BIG in Futures Trading? In this video, I jumped deep into the strategies, tools, and mindset that separate successful traders from those who struggle.
Jan 23, 2025
 3:25SHORTJust added
The descending triangle: flat support, lower highs, and the breakdown that follows — the bearish mirror of the ascending triangle. Anatomy, entry/stop/target, the early-entry trap, and a real chart.
Jun 3, 2026
 0:17SHORTNew
 0:17SHORTNew
Full video: https://youtu. be/aWlgouHU3Q8 Head & Shoulders.
Jun 3, 2026
 0:17SHORTNew
Full video: https://youtu. be/2H6s6u4fiFY Ascending Triangle.
Jun 3, 2026
 0:31SHORTNew
Full video: https://youtu. be/cCkE_h5ZO54 On-Balance Volume.
Jun 2, 2026
 0:17SHORTNew
Full video: https://youtu. be/lgFc8KMRYPw The Pullback Entry.
Jun 2, 2026
 0:48SHORTNew
Liquidity — Buy-side & sell-side. Liquidity is just clusters of stop orders.
Jun 1, 2026
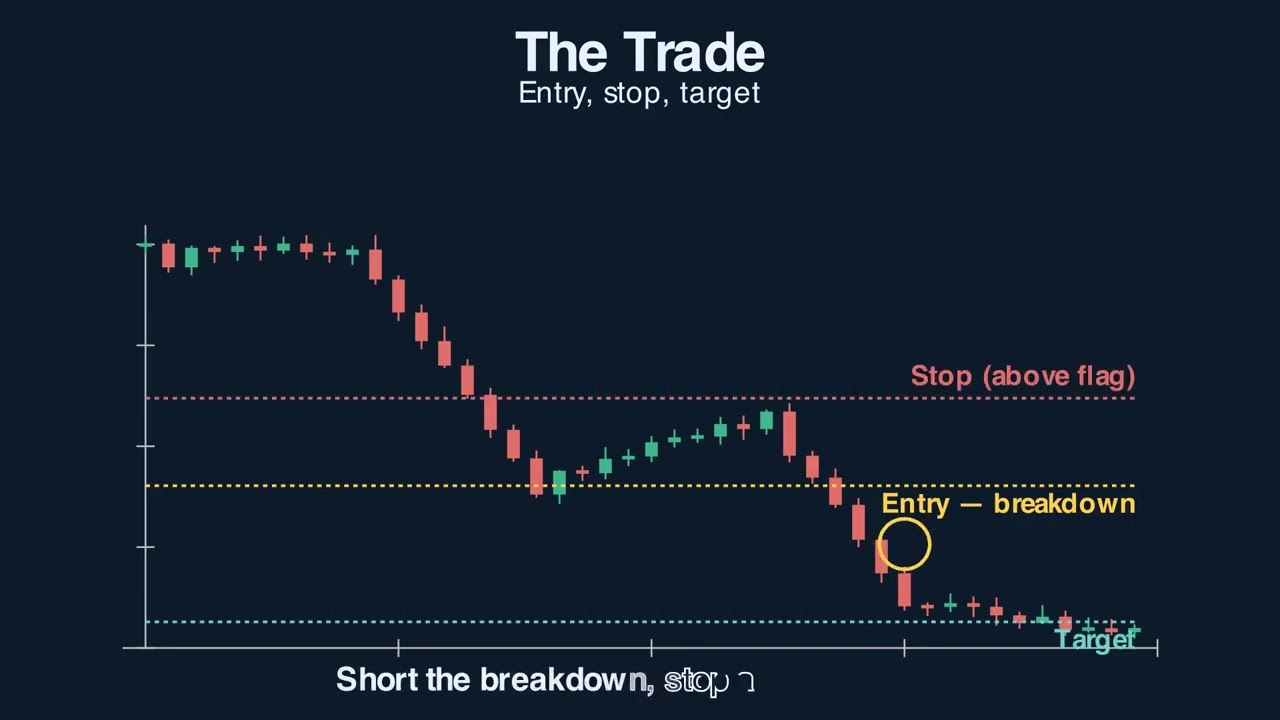 3:13SHORTNew
The bear flag: a sharp drop, a weak upward drift, then continuation lower. The mirror of the bull flag — anatomy, the breakdown trigger, entry/stop/target, and the short-squeeze trap.
Jun 1, 2026
We use privacy-friendly analytics (Google Analytics & Microsoft Clarity) to understand what's useful and improve the lessons. Nothing loads until you accept. See our privacy notice.
Type to search the full catalog.